What to publish
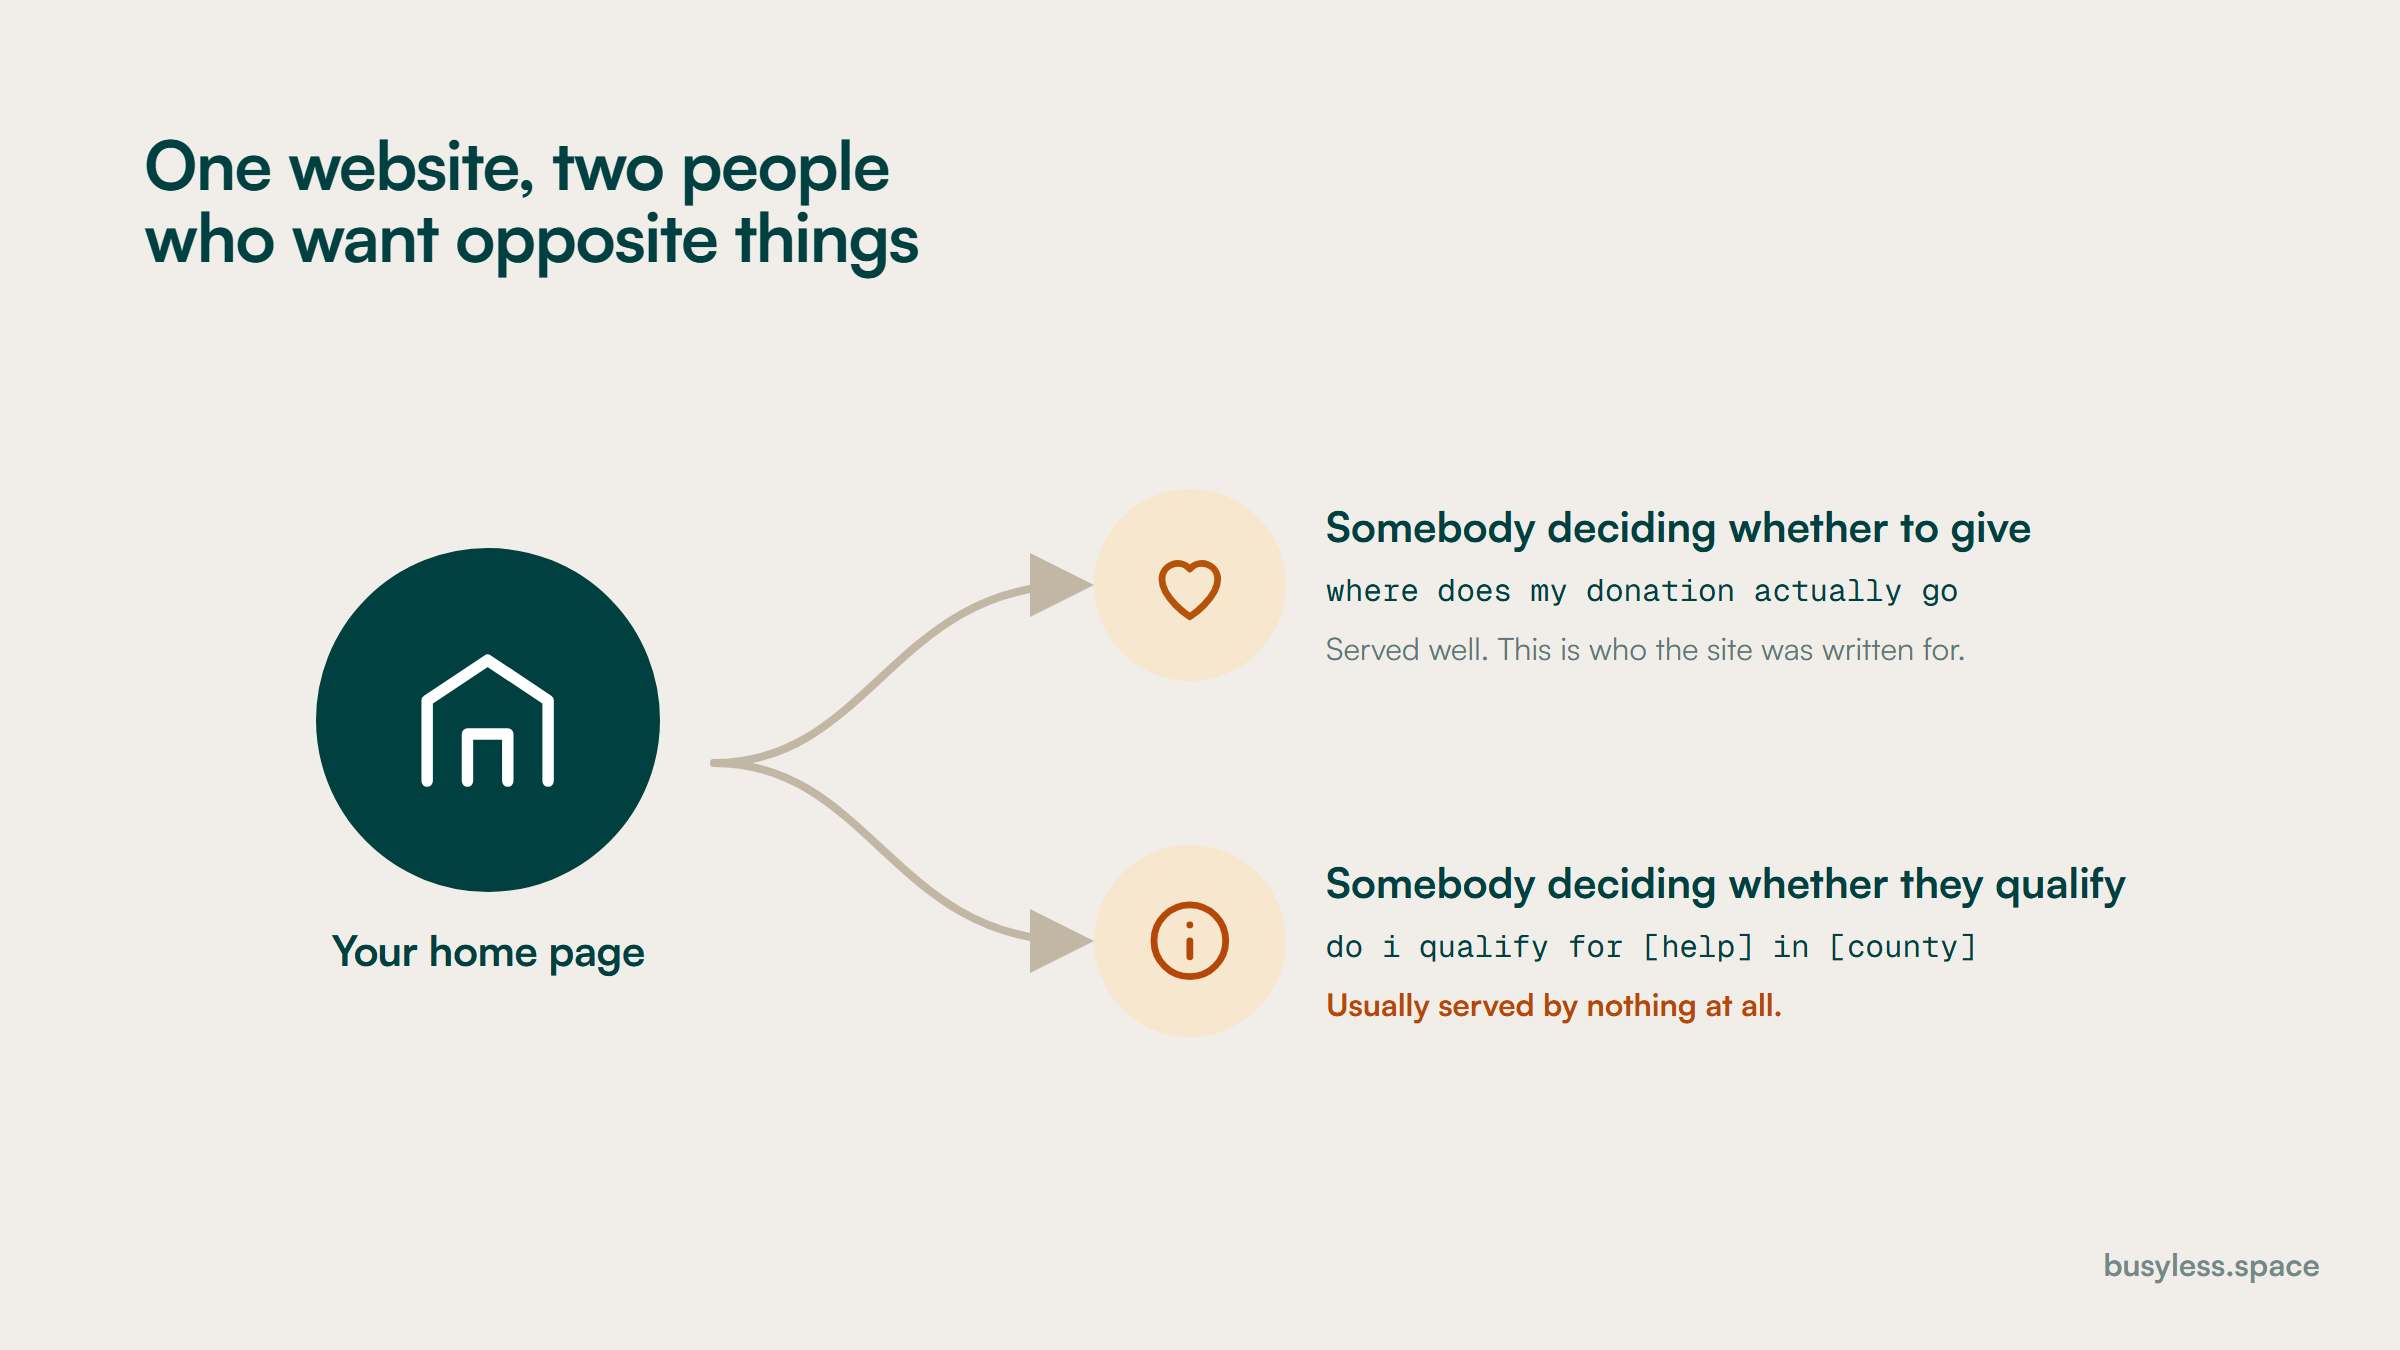
What to publish, ranked by how directly it produces an outcome, whether that outcome is a gift or a person helped. The sector instinct is to publish news about the organisation, which serves neither audience.
Eligibility and access pages
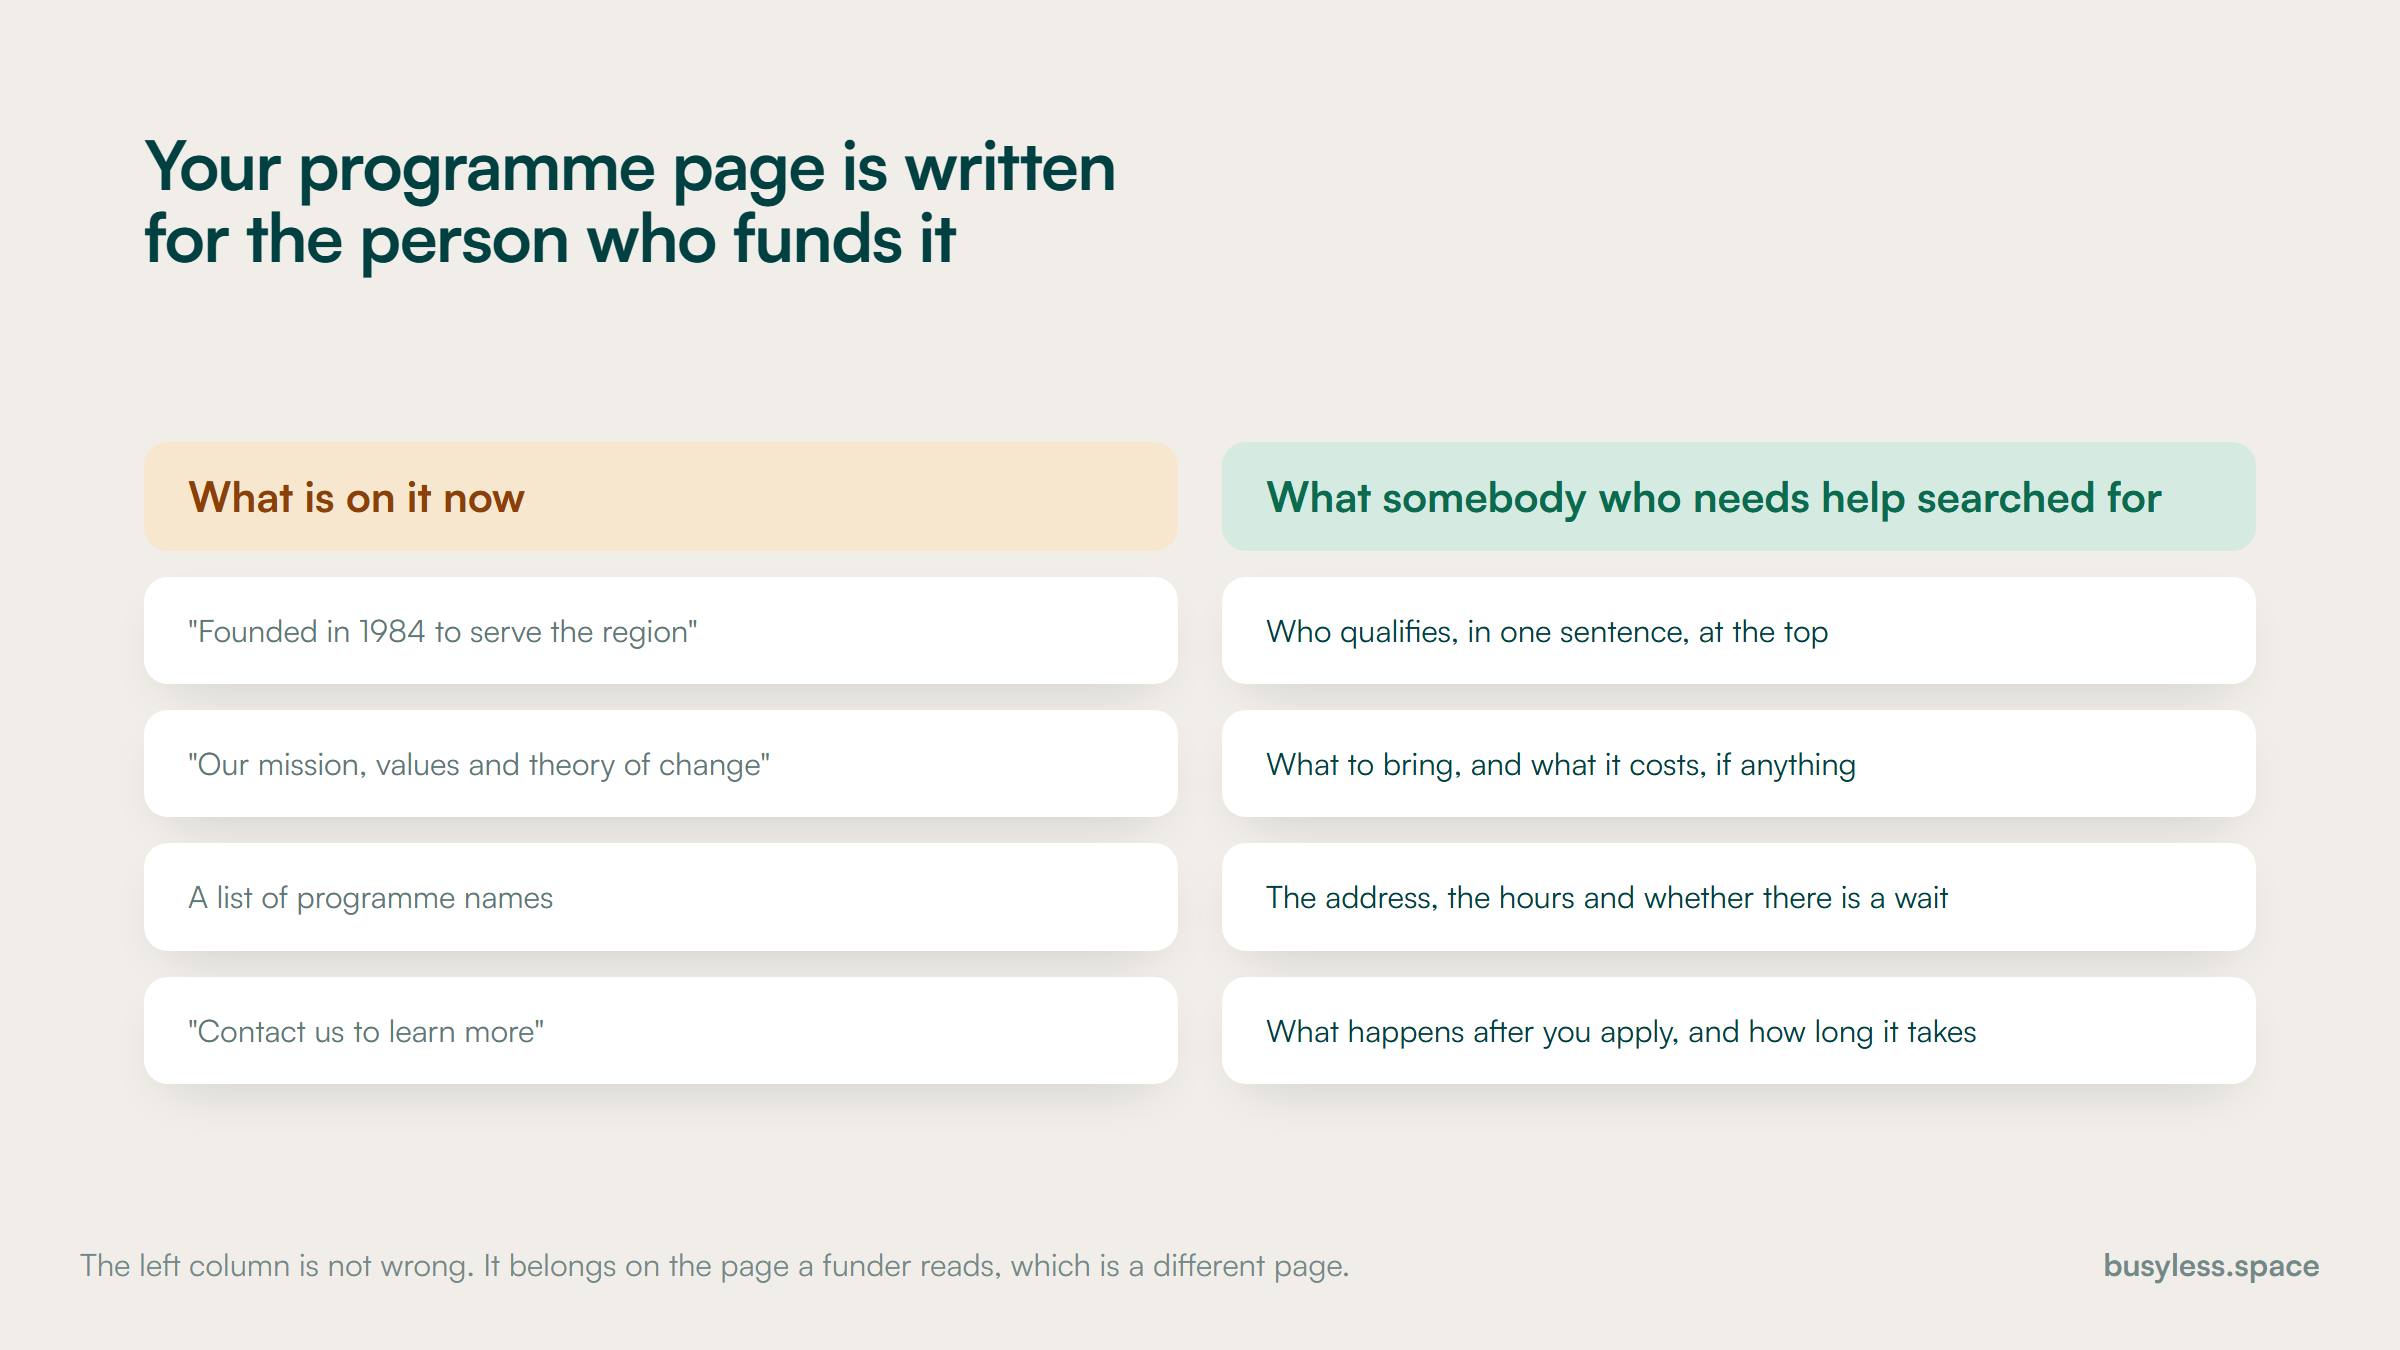
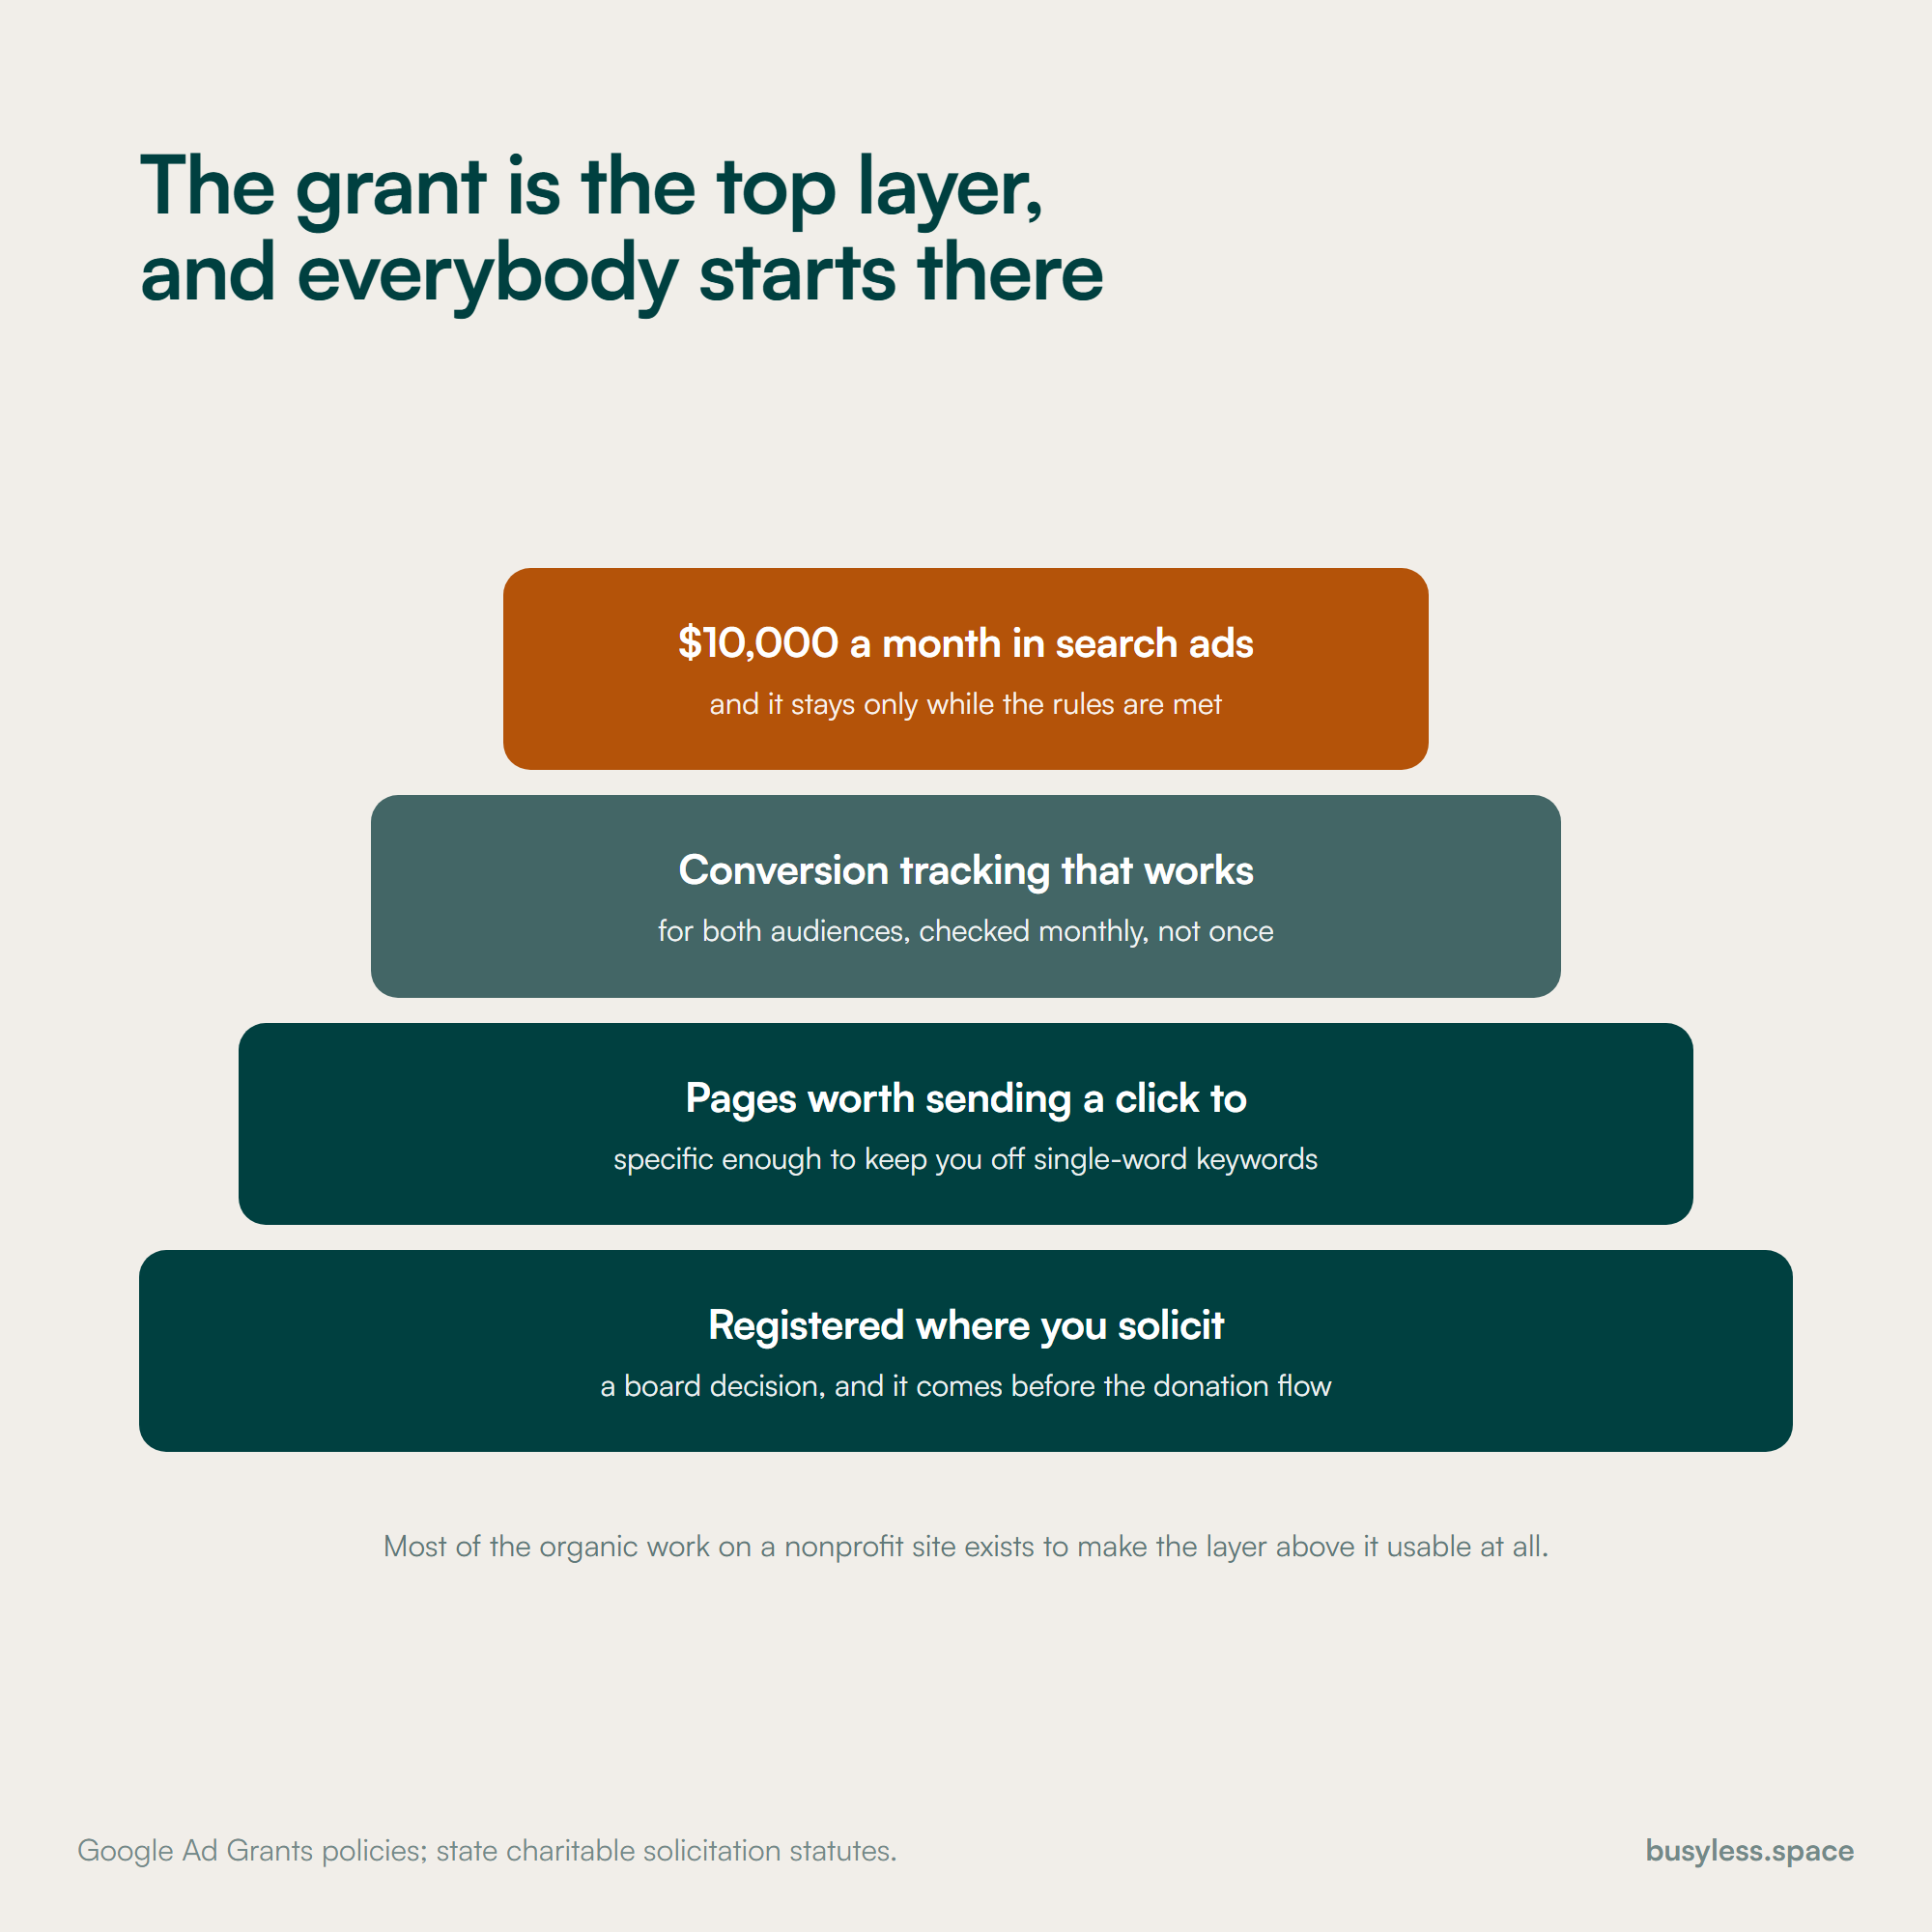
One per programme, reviewed twice a yearThe highest-value content a nonprofit can publish. Searched by people in genuine need, barely contested, serves the mission directly, and doubles as a compliant Ad Grant landing page.
The transparency page
Once, updated with each 990EIN, Form 990, overhead explained, evaluator links. Answers the donor's real question and costs nothing but honesty.
A page per giving mechanism
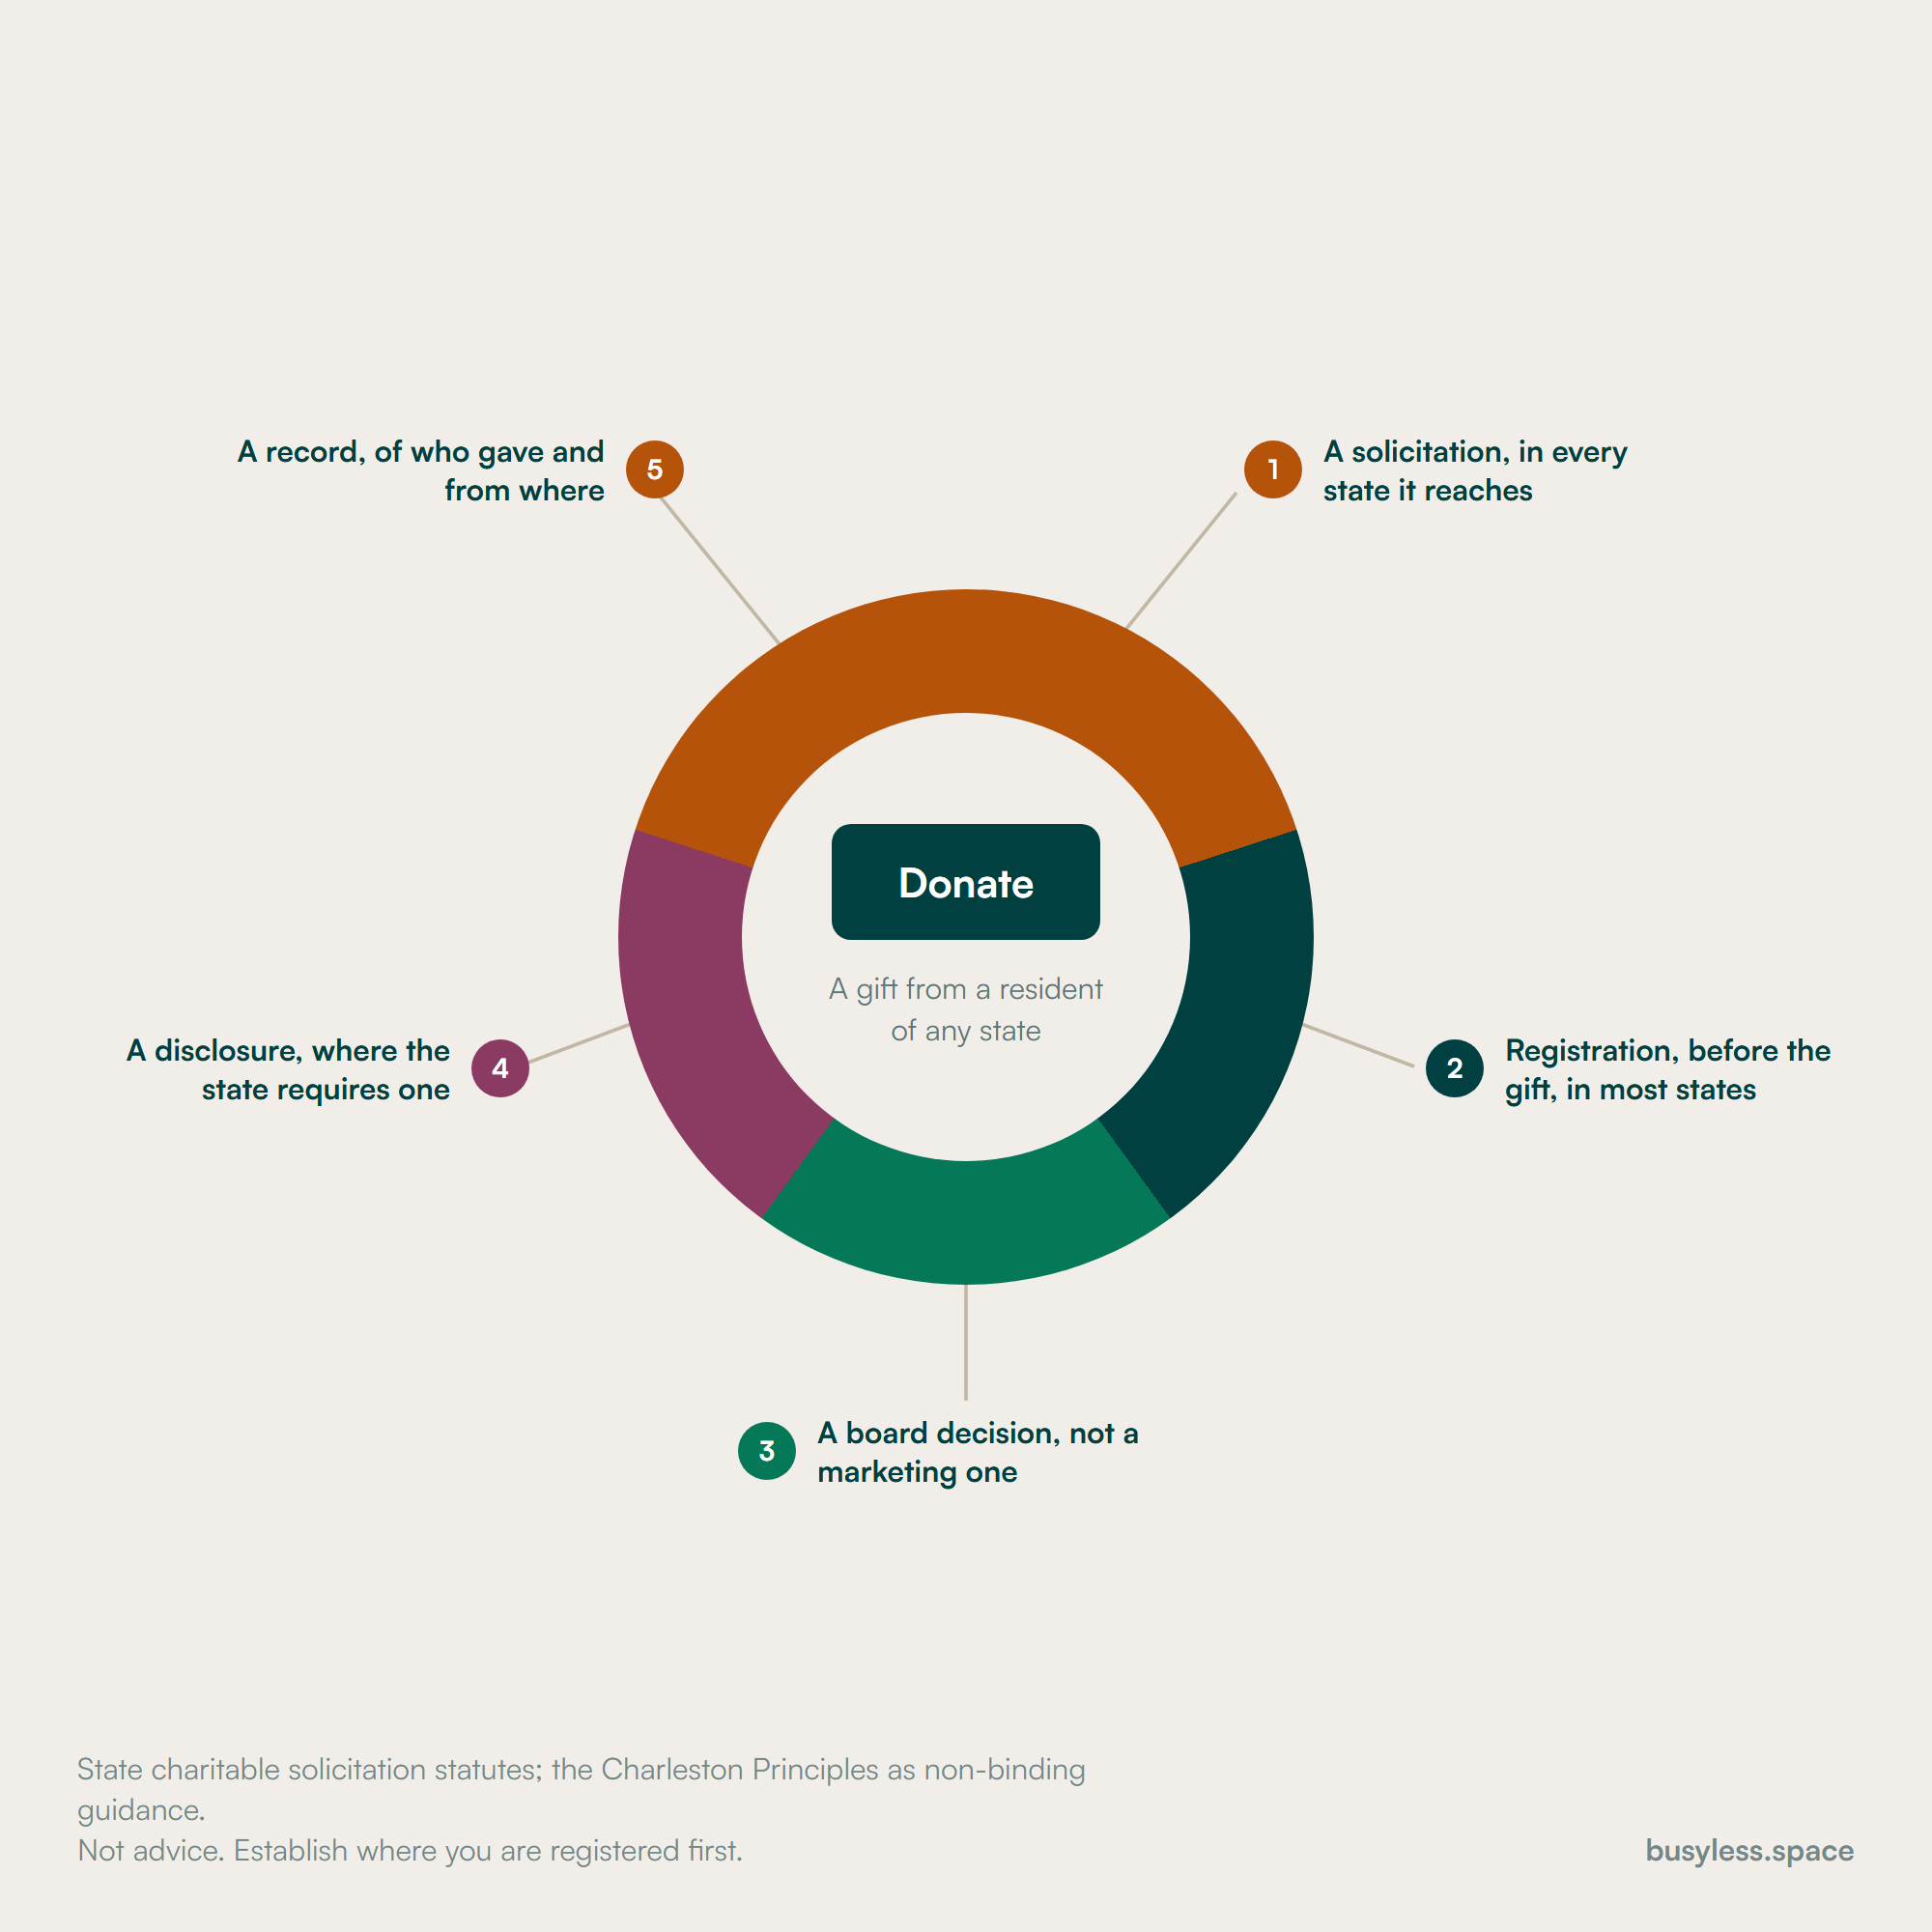
One per mechanism, reviewed annuallyStock, donor-advised funds, qualified charitable distributions and bequests each attract materially larger gifts than a card donation, and each is a distinct search.
Local data on your issue
One or two a year, updated when the source updatesNational statistics are owned by publishers. The county-level version, cited and dated, is where a local organisation becomes the authority on its own subject.
The annual report as a readable page
AnnuallyProgramme officers, researchers and journalists search for exactly this, and a PDF is close to invisible to them.
A volunteer page with real specifics
Once, reviewed each seasonTimes, commitment, requirements and what the work actually involves. The vaguest page on most nonprofit sites and one of the easiest to fix.
And what not to
- Organisation news and staff announcements, which serve neither audience and fill the blog
- Beneficiary stories published without written, informed, revocable consent obtained by somebody other than the service provider
- Statistics with no source or date, which undermine exactly the authority the page is building
- Anything that could read as supporting or opposing a candidate, which is an absolute prohibition rather than a limit
- Programme pages written for funders with no access details, leaving the person who needs help without an answer
- Overhead ratios presented defensively, which reads worse than explaining what overhead actually pays for